We make all our anchor charts with our students as we learn each lesson. It helps them connect to the information, and all of the language on the chart comes from the kids, but let’s face it: They are ugly. We’ve admired beautiful anchor charts online, and while we would love to decorate our classroom with those types of works of art, we believe that our students should be part of making them.
Come learn some of the ways we include our students when making anchor charts.
What is an Anchor Chart?

An anchor chart is any information you are providing to students as a reference. It can be a literal chart on the wall, a page in a book, or a note on the side of your whiteboard. We try to use anchor charts for the most relevant information for each lesson, but we don’t keep them and put them up year after year. Each anchor chart in our classroom is unique to the students and the lessons as we work through the school year.
Why are Anchor Charts Valuable?
Visual Reference
Anchor charts provide students with a visual representation of important concepts, procedures, and strategies, making abstract ideas more tangible and accessible. It can be as simple as a list of words to use when writing or a math problem solved with all the steps.
While it is visual, it should have value and meaning to the classroom and the lessons that are happening. If it doesn’t, it’s just a decoration.
Promotes Student Engagement
By involving students in the creation of anchor charts, they become active participants in their learning process, fostering ownership and engagement. Students can make their own versions of the charts, or you can have students design them from scratch to show you what they know.
Serves as a Reference
Anchor charts serve as a reference tool that students can refer back to during independent work, group activities, or assessments, promoting independent problem-solving and critical thinking. You can train your students to look at the charts when they get stuck or need a hint. They will automatically stop using them when they have mastered the skill.
Encourages Review and Reflection
Revisiting anchor charts allows students to review previously learned content, reinforce understanding, and reflect on their learning progress over time. Before tossing the old anchor charts, bring them out when you bring back topics. We reuse our math anchor charts throughout the school year as we review and master concepts.
How to Make Great Anchor Charts
Honestly, our charts are hideous. We’d love to have time to make wonderful anchor charts that we can share online and marvel at while they hang on the wall, but we just don’t have time for that. Once we make a chart with our class, it gets put up on the wall and is left to die a slow death. Students are constantly pointing at it, touching it, and even writing on it from time to time.
Appoint and Anchor Chart Master
Enter Jaiden, or as we call her, Anchor Chart Master. She said she could make a better anchor chart. The one hanging on the wall was embarrassing but highly effective. We didn’t want to lose it. So, Jaiden took a photo of it with her Chromebook, sent it to herself, took a few pieces of chart paper, and left for the day.
Abracadabra! The next day, she walked in with a beautiful new anchor chart. It had all the information on it, but it was Pinterest pretty!
And we didn’t have to make it.
Well, suddenly, students wanted to redo all the anchor charts in the room. We had to draw straws because we didn’t have enough, but ever since then, we’ve never made our own anchor charts. We’ve even had parent volunteers get involved by making a few. We had no idea the ownership students would have over the walls of our classroom. Get yourself a Jaiden (who will probably be a graphic designer or teacher one day).
Collaborate
You don’t always have to be the one making the anchor chart. One of our favourite things to do while reviewing math concepts is to have students make anchor charts. We give them chart paper and smelly markers, along with specific instructions on what their chart needs to explain. Once they have completed their charts (usually within twenty to thirty minutes), we hang them all up and discuss which one (or ones) we should hang on the wall. The bonus learning in this activity is teaching students to write clearly so that the charts can be read from far away.
Make Clear Charts
This might seem like common sense, but your anchor chart needs to be clearly written, visually appealing (without being confusing), and specific. While we often see anchor charts full of pictures and details, those can be distracting. Keep it clean and simple.
Make sure the way you print or write the letters is legible from across the room. If the writing is too small or too busy, students won’t be able to read it from across the room. It becomes a decoration instead of a reference tool.
Ideas for Anchor Charts
Graphic Organizers
Use graphic organizers such as Venn diagrams, T-charts, or concept maps to organize information visually and facilitate comprehension of complex topics. You can easily create these types of charts together as a class to teach content and how to use charts to organize information.
KWL Charts
Create KWL (Think You Know, Want to Know, Learned) charts at the beginning of a new unit or lesson to activate prior knowledge, set learning goals, and track learning progress. Keep the chart throughout the unit and check to see your progress as you go.
Step-by-Step Procedures
Develop step-by-step procedures or algorithms for problem-solving processes, writing strategies, or scientific methods to guide students through sequential tasks. These types of charts come in so handy, especially if you’re trying to limit the amount of screen time in your classroom.
Our entire math notebook series is a collection of anchor charts that students make in their math notebooks. By the end of the school year, your students could have an anchor chart for every concept they learn in math all year long.
- Interactive Math Full Year Grade 3 in our TpT Store ($USD) or our BN Shop ($CAN).
- Interactive Math Full Year Grade 4 in our TpT Store ($USD) or our BN Shop ($CAN).
- Interactive Math Full Year Grade 4/5 in our TpT Store ($USD) or our BN Shop ($CAN). This is designed for combined classrooms with two grades working in the same room.
- Interactive Math Full Year Grade 5 in our TpT Store ($USD) or our BN Shop ($CAN).
- Interactive Math Full Year Grade 5/6 in our TpT Store ($USD) or our BN Shop ($CAN). This is designed for combined classrooms with two grades working in the same room.
- Interactive Math Full Year Grade 6 in our TpT Store ($USD) or our BN Shop ($CAN).
To learn more about what is included in our interactive math units, check out this post: How to Change Math With Interactive Notebooks.
Word Walls
Design word walls featuring key vocabulary terms, definitions, and visual representations to support language development and content-area learning. If you’re looking for ways to better use your word wall, check out this post: 22 Amazing Ways to Use Word Wall Words.
Anchor Charts for Strategies
Create anchor charts for reading comprehension strategies, mathematical problem-solving strategies, or writing techniques to provide students with reference tools for independent practice. Students are great for coming up with strategies. Create a place for students to list their strategies and add to them as they learn new ones.
We use the learning pit as a way to help students overcome frustration while learning. This post has instructions on how to make an anchor chart: Use the Learning Pit to Teach Growth Mindset.
Content-Specific Charts
Design content-specific anchor charts for subjects such as math (e.g., multiplication strategies, geometry formulas), science (e.g., scientific method, life cycle diagrams), or language arts (e.g., parts of speech, writing genres). These are great for teaching and for review.
Ninja Note: If you LOVE making anchor charts, then keep making them yourself. We ninjas just aren’t known for our artistic ability; we’re better with words. Anchor charts are not found in our happy places.
Quality or Completion of Work
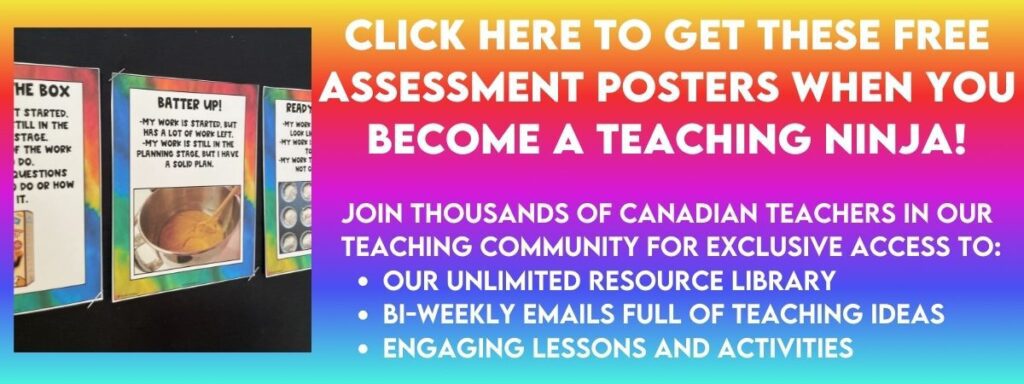
When our students were constantly asking, “Is this done?” we came up with a set of posters and a lesson to help teach them how to solve this problem on their own. It shows the different levels of completion and what each looks like while using an analogy of cupcakes. It has been a staple in our classroom for over ten years.
We’ll send the Cupcake Assessment Scale to you for free when you sign up for our email list. If you’re already on the list, you can find it in our Resource Library. Once you have the posters, your students can make illustrative examples for each level, so they are included in the process.
Tips for Displaying and Storing Anchor Charts
Most of our anchor charts are placed on a bulletin board along the side of our classroom. We use clips to hold posters together and rearrange them based on the subject we’re working on. We keep all of our posters throughout the year and then recycle them at the end of the school year, BUT before we toss them, we photograph them all. This helps us keep track of some of the great posters we’ve used throughout the year so we can steal from them the next school year.
If we are getting overrun with charts or if only some students still need the reference, photographing comes in handy here, too. We print a copy of the chart so students can keep them on their desks or in their assigned notebook. Sometimes, we put the photographs in our Google Classroom so students can refer to them as needed, but they don’t take up any space.
If you have unlimited walls, you can keep all your anchor charts, but we honestly recommend making new ones with your students so they are more meaningful.
Do you have an anchor chart strategy? Let us know in the comments below.