Most students feel comfortable making a bar graph, but line plots (or dot plots) can be difficult for some students. It is important to understand line plots so you can teach your students to master them. Come learn how we introduce and teach dot plots to our students as part of our graphing and statistics lessons.
What is a Line Plot?
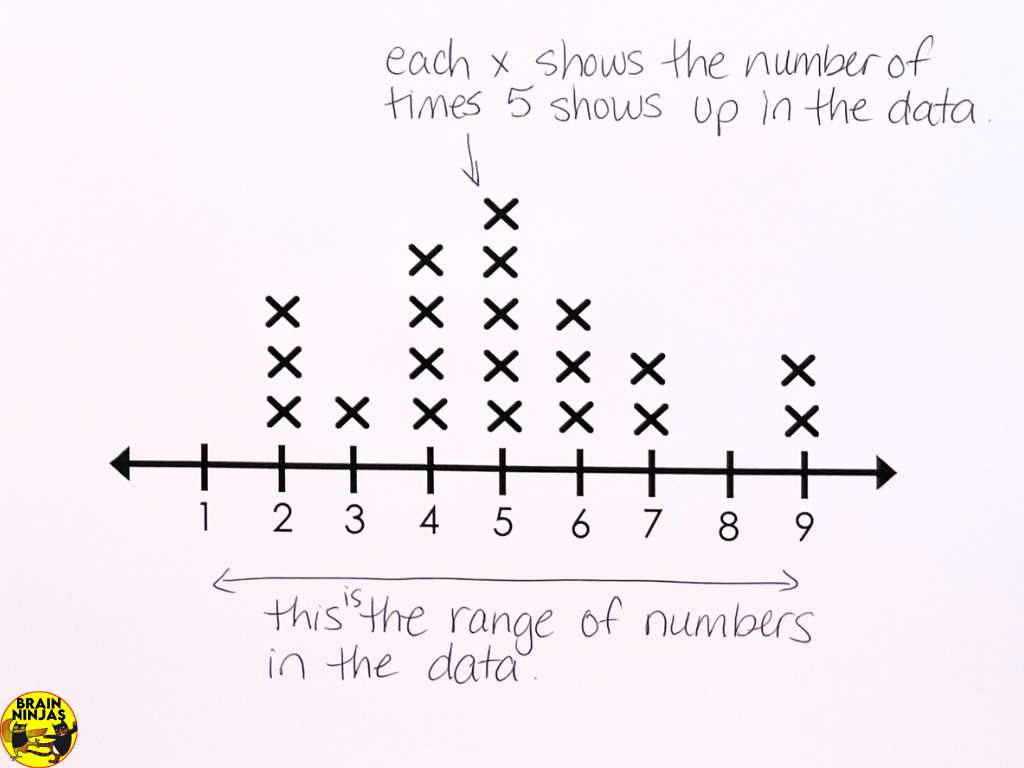
A line plot is a simple graph that shows data points along a number line. Each data point is represented by an “X” above the number line. Line plots are useful for showing the frequency of data points within a specific range.
Phew! That sounds like a lot. Basically, it’s a graph that shows the number of times one data point shows up. Picture a number line numbered one through five. Imagine you have collected data where the answer is a number from one through five. Each time the number one appears in the data set, an X is placed on the number line above the number one. This continues for all the numbers in the data set until they are all placed on the number line.
If you compare a line plot to a bar graph, you will see that there is no y-axis.
Introduce Line Plots to Your Students
Begin by explaining what a line plot is and how it differs from other graphs. You may want to have pictures of a variety of graphs just to show students some of the different ways graphs can be created. They don’t need to know the names of all the graphs but highlight ones that are specific to your curriculum.
Create a Graph
The best way to learn about a line plot is by making one. Create a number line with numbers from one to fourteen on the whiteboard. Ask students to look at the shoe size (if this is going to cause mass chaos with shoes flying about, do ages instead). Students will plot their shoe size on the number line by placing an X above their size.
One-To-One Correspondence on Line Plots
First, explain that each dot or mark represents one item. So, if a place along the line has five, then you need five dots. For one-to-one correspondence, each symbol must represent one data point.
Analyze a Line Plot

Present a completed line plot to the class by creating one on your whiteboard. Give it a title and explain what it is about in very general terms.
Ask these questions to guide understanding. We’ve included the information you should be looking for from your students.
What does each “X” represent? Students should be able to explain that the X represents each time the number showed up in the data set. A data set is just a fancy way of saying all the numbers that were collected to make the graph.
What is the most frequent data point? This is the place on the number line with the most X marks.
What is the least frequent data point? This is the place on the number line with the least X marks.
What is the range of the data? This is the first number on the number line with an X all the way to the last number on the number line with an X. For example, if the number line has numbers from one through fourteen, but the Xs only appear on the numbers from three to eleven, the range is three to eleven.
Practice Reading and Creating Line Plots
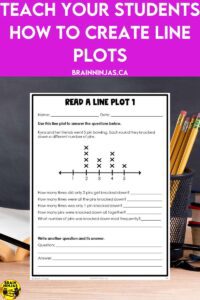
Provide students with various line plots to analyze. Include line plots with different data ranges and frequencies. Ask students to answer questions about the data represented in each line plot.
These can be a lot to draw out, but fortunately, we’ve already made lots of graphs you can use. We’ve also created entire lesson plans with everything you need to teach, practice, review, and assess.
- Statistics and Graphing Interactive Math Unit for Grade 3 on TpT ($USD) or BN Shop ($CAN).
- Statistics and Probability Interactive Math Unit for Grade 4 on TpT ($USD) or BN Shop ($CAN).
- Statistics and Probability Interactive Math Unit for Grade 4/5 on TpT ($USD) or BN Shop ($CAN). This is designed for combined grade-level classes.
- Statistics and Probability Interactive Math Unit for Grade 5 on TpT ($USD) or BN Shop ($CAN).
- Statistics and Probability Interactive Math Unit for Grade 5/6 on TpT ($USD) or BN Shop ($CAN). This is designed for combined grade-level classes.
These worksheet sets encourage students to read and create line plots using data we’ve already collected. You can use these worksheets to teach, practice, or assess.
- Line Plots One-to-One Correspondence Worksheets on TpT ($USD) or BN Shop ($CAN).
- Line Plots Many-to-One Correspondence Worksheets on TpT ($USD) or BN Shop ($CAN).
Making Line Plots

If you are going to have students create their own line plots, there are a few steps they will need to take.
First, work with your students to collect data on a topic that interests them. They could collect data about the number of pets in their homes, their heights, the minutes they spend reading, the number of pencils in their pencil cases, or the number of pages they’ve read this week. Avoid topics that could divide your students or cause competition with the numbers.
Help students organize the data using a tally chart or a frequency table.
Draw a number line or provide students with graph paper. They may need help determining the appropriate scale for the number line based on the range of the data.
Help students plot the data by guiding students to place Xs above the number line to represent each data point.
Once the line plot is complete, have students analyze the data. Ask questions to help them interpret the information. This will also help them notice any patterns or trends on their graphs.
Line plots are a great introduction to graphing, and although they seem difficult at first, they are one of the simplest types of graphs.
We’ll send this free set of graphing worksheets when you sign up for our email list. If you’re already on the list, you can find them in our Resource Library.

Do You Teach Math in Canada?
We have other math blog posts that you might find helpful.
- Plotting on the Cartesian Plane During Math Class
- How to Differentiate Your Math Lessons
- Ways to Bring Graphing Activities into Your Classroom Daily
What are some of the ways you teach line plots in your math class? We’d love to hear about it. Leave us a comment below.