It always surprises me when I hear teachers saying they are starting a math unit on graphing and statistics. Reading a graph or a chart is a skill we use throughout many subject areas. Looking at patterns in statistics comes up in science and social studies all the time. Here are the ways we weave graphing activities into our classroom all year long and throughout the different subject areas.
Types of Graphs and Charts
There are many types of graphs and charts that students need to learn about. Different grades learn different types of graphs. Our grade levels correspond to Alberta. Graphs are found in many subject areas. We teach students the correct names for the different ways data is organized whenever we come across one.
Line plots feature a number line with a set of markers along it.
Pictographs feature symbols or pictures that represent a number.
Bar graphs use an x-axis and a y-axis to plot data in bars or rectangles.
Double bar graphs use an x-axis and a y-axis to plot data in bars or rectangles but have the ability to plot more than one set of data.
Venn Diagrams use two or more circles placed so they overlap. They are used to sort data or information. Similarities are placed in the space where the circles overlap. Differences are written in the individual circles.
Carroll Diagrams are two-way tables. Items are written in boxes to match categories or characteristics.
We have activities for Venn Diagrams and Carroll Diagrams in our Sorting Data Worksheets (designed for Grade 3). You can find these on TpT ($USD) or our BN Shop ($CAN).
Stem and leaf plots split data into stems (the largest digit) and leaves (the smallest digits). We have activities for stem and leaf plots designed for grade 5. You can find these on TpT ($USD) or our BN Shop ($CAN).
Pie graphs (or pie charts or circle charts) slice a circle into pieces to represent data.
Line graphs plot individual data points on a grid with dots and connect them with lines.
Graphing and Statistics in Math Class

Explicit Teaching
Students need to learn how to read the different parts of different types of graphs. They do not magically learn to read and create graphs, so a variety of graphing activities throughout your teaching is important to allow students to explore lots of different types of graphs.
Interactive Math Units for Graphing Activities
We use Interactive Units to teach. Learn more about them in this blog post: How to Change Math With Interactive Notebooks. We create reference pages along with our students. All of our units include complete lesson plans, student pages, assessments, activities for practice and checklists for outcomes. They align with Alberta, British Columbia and Saskatchewan.
Statistics and Probability Interactive Unit for Grade 3
Includes line plots, bar graphs, Venn Diagrams, Carroll Diagrams and tally marks. This unit focuses on one-to-one correspondence. Find this unit on TpT ($USD) or our BN Shop ($CAN). Find the year-long bundle on TpT ($USD) or our BN Shop ($CAN).
Statistics and Probability Interactive Unit for Grade 4
Includes bar graphs, pictographs, double graphs, stem and leaf plots, probability, and primary and secondary sources. Find this unit on TpT ($USD) or our BN Shop ($CAN). Find the year-long bundle on TpT ($USD) or our BN Shop ($CAN).
Statistics and Probability Interactive Notebook for Grades 4/5
Includes pictographs, bar graphs, double bar graphs and primary and secondary sources. This unit is designed for combined classes. Find this unit on TpT ($USD) or our BN Shop ($CAN). Find the year-long bundle on TpT ($USD) or our BN Shop ($CAN).
Statistics and Probability Interactive Unit for Grade 5
Includes bar graphs, pictographs, double bar graphs, stem and leaf plots, probability and primary and secondary sources. Find this unit on TpT ($USD) or our BN Shop ($CAN). Find the year-long bundle on TpT ($USD) or our BN Shop ($CAN).
Statistics and Probability Interactive Unit for Grades 5/6
Includes bar graphs, double bar graphs, stem and leaf plots, line graphs, and primary and secondary sources. This unit is designed for combined classes. Find this unit on TpT ($USD) or our BN Shop ($CAN). Find the year-long bundle on TpT ($USD) or our BN Shop ($CAN).
Statistics and Probability Interactive Unit for Grade 6
Includes double bar graphs, line graphs, stem and leaf plots, line graphs, probability and primary and secondary sources. Find this unit on TpT ($USD) or our BN Shop ($CAN). Find the year-long bundle on TpT ($USD) or our BN Shop ($CAN).

Worksheets to Practice Graphing Activities
One of the ways we do this is through math class. This set allows students to read and create different types of graphs. There are opportunities to create graphs using primary and secondary data. We use these sets to practice working with different types of graphs.
The grade levels are just a guideline. It depends on the province or territory where you live, but we have aligned each set to the Alberta math outcomes. When we create more sets, we will add them.
Grade 3 Graphing Activities
Sorting Data and Tally Marks – find on TpT ($USD) or our BN Shop ($CAN)
Line Plots – find on TpT ($USD) or our BN Shop ($CAN)
Bar Graphs – find on TpT ($USD) or our BN Shop ($CAN)
Pictographs – find on TpT ($USD) or our BN Shop ($CAN)
Probability Outcomes – find on TpT ($USD) or our BN Shop ($CAN)
All the Math Worksheets Grade 3 – find on TpT ($USD) or our BN Shop ($CAN)
Grade 4 Graphing Activities
Bar Graphs (Many-To-One) – find on TpT ($USD) or our BN Shop ($CAN)
Line Plots (Many-To-One) – find on TpT ($USD) or our BN Shop ($CAN)
Pictographs (Many-To-One) – find on TpT ($USD) or our BN Shop ($CAN)
Probability: Chance & Uncertainty – find on TpT ($USD) or our BN Shop ($CAN)
All the Math Worksheets Grade 4 – find on TpT ($USD) or our BN Shop ($CAN)
Grade 5 Graphing Activities
Pictographs (Many-To-One) – find on TpT ($USD) or our BN Shop ($CAN)
Double Bar Graphs (Many-To-One) – find on TpT ($USD) or our BN Shop ($CAN)
Reading & Creating Bar Graphs – find on TpT ($USD) or our BN Shop ($CAN)
Stem & Leaf Plots – find on TpT ($USD) or our BN Shop ($CAN)
Predicting Probability Outcomes – find on TpT ($USD) or our BN Shop ($CAN)
All the Math Worksheets Grade 5 – find on TpT ($USD) or our BN Shop ($CAN)
Grade 6 Graphing Activities
Interpreting a Variety of Graphs – find on TpT ($USD) or our BN Shop ($CAN)
Describing Probability Outcomes – find on TpT ($USD) or our BN Shop ($CAN)
Theoretical and Experimental Probability – find on TpT ($USD) or our BN Shop ($CAN)
Broken and Continuous Line Graphs – find on TpT ($USD) or our BN Shop ($CAN)
All the Math Worksheets Grade 6 – find on TpT ($USD) or our BN Shop ($CAN)
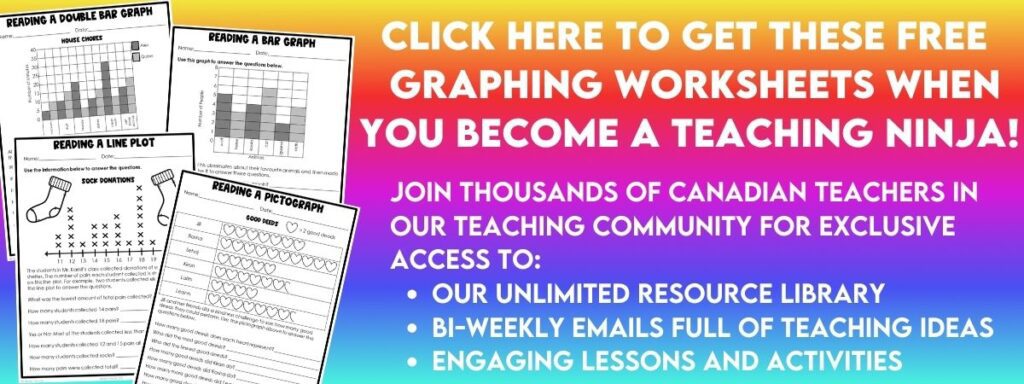
Want to try out some of our graphing worksheets for free? We’ll send you a sample when you sign up for our email list. Or, if you are already on our list, you can find a copy in the Resource Library.
Recording Math Statistics
One of the best ways to help your students understand graphs is to create them in authentic ways. We encourage our students to track their progress as they learn their math facts. They share their graphs with their families at different times of the year. Students make statements about their graphs and even use them to create new goals for themselves.
These sets include multiplication and division fact families along with a variety of grids to use for graphing. Students can self-check their answers with the answer keys.
Math Facts Graphing Up to 5 x 5 is designed for Grade 3 – Find it on TpT ($USD) or our BN Shop ($CAN).
Our Math Facts Graphing Up to 7 x 7 is designed for Grade 4 – Find it on TpT ($USD) or our BN Shop ($CAN).
Math Facts Graphing Up to 9 x 9 is designed for Grade 5 – Find it on TpT ($USD) or our BN Shop ($CAN).
Our Math Facts Graphing Up to 10 x 10 can be used for any grade – Find it on TpT ($USD) or our BN Shop ($CAN).
We also have a Math Facts Graphing set for up to 12 x 12 that can be used for any grade – Find it on TpT ($USD) or our BN Shop ($CAN).
These sets can be purchased in a bundle. This makes differentiation easier. You can find the Multiplication and Division Facts Drill and Graph Bundle on TpT ($USD) or our BN Shop ($CAN).
Graphs and Charts in Social Studies

Venn Diagrams sort similarities and differences between events, people, and places. Graphs can show changes over time. Tables display information.
Encourage your students to talk about the information in graphs and tables in your social studies textbooks or books that you borrow from the library.
Use information from your textbooks to create graphs with your students.
Reading, Interpreting and Recording Statistics in Science Class
Venn Diagrams and Carroll Diagrams to sort characteristics of different materials in science. Scientists record observations in tables. Graphs share information about experiments and observations.
Your students will probably use graphs and tables all the time in science and not even know it. So, every time you come across one, be sure to point it out. What type of graph is it? What is it showing? How are the numbers displayed on the y-axis? What does the data show? What questions can be asked based on the data?
Reading Text Features in Language Arts
Most texts used in schools today include text features. With the exception of novels and picture books, most books contain graphs, tables, textboxes, maps, and so many text features. You can try a text feature activity for free with your students. Sign up for our email, and we’ll send you an activity to do with your students to learn about text features. If you’re already a ninja, you can find the Text Features activity in our Resource Library.
Reading charts and tables is one way to condense information Instead of writing entire paragraphs. A lot of information fits in one little table.
Nonfiction reading passages, textbooks and books often have graphs and charts. We included graphs in some of our Weekly Reading Comprehension Skills sets on TpT ($USD) or our BN Shop ($CAN). These sets touch on concepts from science and social studies while having students work on text features, word parts, vocabulary and general reading comprehension.
You can try our Permafrost Weekly Reader for free. It includes a line graph that you can use as an example. Find it on TpT ($USD) or our BN Shop ($CAN).

Start With a Graph of the Day
Add a graph to your school day each and every day. Give each student a magnet, clip or sticky note with each student’s name. Collect data by asking a question. Have students place their name marker to align with the question. Now they’ve made a graph (and you’ve taken attendance).
You can easily digitize this activity by having students move a dot or text box with their name in a shared Google Slides file.
Use Graphing Tools
There are online graph creators like Create a Graph Website, Google Forms, and Google Sheets. These can create digital graphs.
Create a Graph is somewhat kid-friendly. Your students will need to know some graphing basics to use it. They need to know the data that will be placed on the y-axis and x-axis. Students should have labels in mind. This site can be a bit of a rabbit hole, so we recommend modelling it a few times and then letting your students explore.
Google Forms are mostly kid-friendly if you let students explore and figure it out before needing them to create something specific. Google Sheets are a little more complicated, but students can learn to use this format if they take their time and are comfortable with making lots of little mistakes along the way.
We like to get our grid paper at this site because you can make pretty much any size or type you like. It’s free and easy to use.
Teaching Math?
You might find some of our other posts helpful.
- How to Add Candy to Your Math Lessons
- Conquer Math With These Proven Multiplication Strategies
- The Truth About New Math
- How to Change Math With Interactive Notebooks
- How to Use Interactive Notebooks to Teach Number Sense
- Mastering the Angles: Innovative Approaches to Teaching Geometry Concepts
- How to Teach Students to Analyze Errors in Math
- How to Help Your Students Master Decimal Operations
- How to Teach Successful Long Division Strategies
- How to Make Teaching Patterns Painless
- Ways to Teach Classifying Triangles
- How to Teach Rounding Numbers
What are some of your favourite ways to include graphing in your lessons? We’d love to hear about it. Leave us a comment below.


